
|
Adopted from Adriani et al. (2009), Letters to Nature, v. 458, p. 607. |
| PAMELA positron fraction with other experimental data and with secondary production model. The positron fraction measured by the PAMELA experiment compared with other recent experimental data. Error bars show 1 s.d.; if not visible, they lie inside the data points. | |

|
Adopted from Boezio et al. (2012), Hyperfine Interactions, v. 213, p. 147 |
|
Left panel: The PAMELA positron fraction
(e+/(e++e-)) [1] compared with other
experimental data [13 - 20] and with predictions of a secondary
production model (solid line) [21].
Right panel: The PAMELA electron (e-) spectrum [3] compared with recent electron and electron plus positron (e++e-) data [17, 22 - 30]. |
|
|
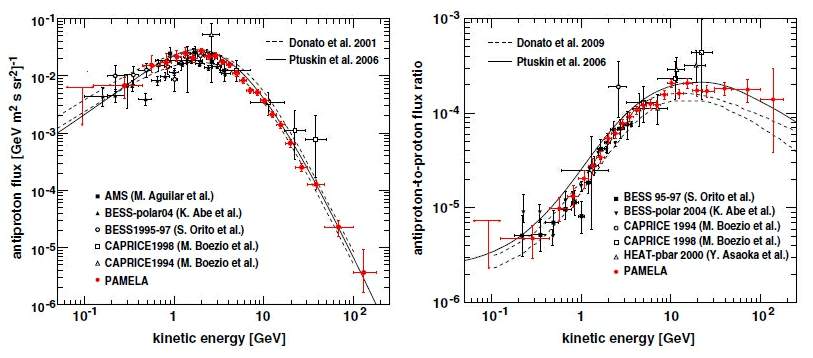
Adopted from Boezio et al. (2012), Hyperfine Interactions, v. 213, p. 147 |
| The antiproton stectrum (left) and antiproton-to-proton flux ratio (right) measured by PAMELA [2], compared with data from other contemporary experiments [4 - 9] and theoretical calculations for purely secondary production of antiprotons in the Galaxy [10 - 12]. | |