
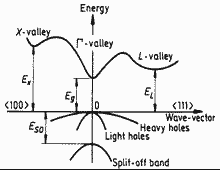
Eg = 1.42 eV
EL = 1.71 eV
EX= 1.90 eV
Eso = 0.34 eV
Eg= 0.726 eV
EL = 0.81 eV
EX = 1.03 eV
Eso = 0.8 eV
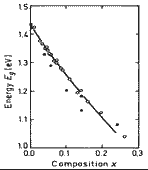
(Biryulin et al. (1979,a)).

| Energy gap | 1.42-1.9x+1.2x2 (for 0<x<0.3) |
| Effective conduction band density of states | 2.5·1019·(0.063-0.0495x+0.0258x2)3/2 cm-3 |
 |
Band structure and carrier concentration of GaAs. 300 K Eg = 1.42 eV EL = 1.71 eV EX= 1.90 eV Eso = 0.34 eV |
 |
Band structure and carrier concentration of GaSb. 300 K Eg= 0.726 eV EL = 0.81 eV EX = 1.03 eV Eso = 0.8 eV |
 |
Variation of energy gap Eg with composition x for GaAs1-xSbx (Biryulin et al. (1979,a)). |
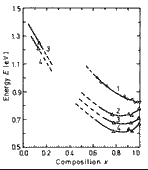 |
Energy separation between L- valley of conduction band and top of the valence band (curve 1; Rosenbaum and Woolley (1975)) and energy gap (Curves 2-4; Taylor and Fortin (1970)) versus composition x. 2 - T=100 K, 3 - T=210 K, 1,4 -T=300 K. |
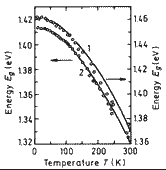 |
Temperature dependence of energy gap Eg for GaAs1-xSbx. 1 - x = 0.026, 2 - x = 0.05. ( Biryulin et al. (1979,b)). |
 |
The temperature dependences of the intrinsic carrier concentration. 1 - x=0 (GaAs), 2 - x=0.3, 3 - x=0.8, 4 - x=1 (GaSb) . |
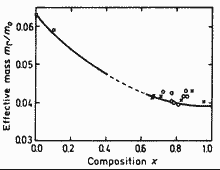 |
Dependence of electron effective mass m on composition parameter x. The curve is calculated. Dashed part of the curve corresponds to the miscibility gap. Symbols are experimental data taken from Delvin et al. (1981). |
| Heavy | mh = (0.51 - 0.11x) mo |
| Light | mlp = (0.082 - 0.032x )mo |
| Split-off band | mso = 0.15 mo |
| S | Se | Te | |
| x=0 (GaAs): | 6 | 6 | 30 |
| x=1 (GaSb): L | 150 | 50 | 20 |
| x=1 (GaSb): X | 300 | 230 | <80 |
| Si | Zn | Ge | |
| x=0 (GaAs): | 30 100 220 |
25 | 30 |
| x=1 (GaSb): | 10 | 37 | 9 |